In this installment, we'll cover both low-level graphics (using Cairo) and plotting graphs inside GUIs (using Winston). Here again we're relying on infrastructure built by many people, including Jeff Bezanson, Mike Nolta, and Keno Fisher.
Cairo
The basics
The display of the image is handled by Cairo, a C library for two-dimensional drawing. Julia's Cairo wrapper isn't currently documented, so let's walk through a couple of basics first.
If you're new to graphics libraries like Cairo, there are a few concepts that may not be immediately obvious but are introduced in the Cairo tutorial. The key concept is that the Cairo API works like "stamping," where a source gets applied to a destination in a region specified by a path. Here, the destination will be the pixels corresponding to a region of a window on the screen. We'll control the source and the path to achieve the effects we want.
Let's play with this. First, inside a new window we create a Cairo-enabled Canvas for drawing:
using Base.Graphics
using Cairo
using Tk

win = Toplevel("Test", 400, 200)
c = Canvas(win)
pack(c, expand=true, fill="both")
We've created a window 400 pixels wide and 200 pixels high. c is our Canvas, a type defined in the Tk package. Later we'll dig into the internals a bit, but for now suffice it to say that a Canvas is a multi-component object that you can often treat as a black box. The initial call creating the canvas leaves a lot of its fields undefined, because you don't yet know crucial details like the size of the canvas. The call to pack specifies that this canvas fills the entire window, and simultaneously fills in the missing information in the Canvas object itself.
Note that the window is currently blank, because we haven't drawn anything to it yet, so you can see whatever was lying underneath. In my case it captured a small region of my desktop:
Now let's do some drawing. Cairo doesn't know anything about Tk Canvases, so we have to pull out the part of it that works directly with Cairo:
ctx = getgc(c)getgc means "get graphics context," returning an object (here ctx) that holds all relevant information about the current state of drawing to this canvas.
One nice feature of Cairo is that the coordinates are abstracted; ultimately we care about screen pixels, but we can set up user coordinates that have whatever scaling is natural to the problem. We just have to tell Cairo how to convert user coordinates to device (screen) coordinates. We set up a coordinate system using set_coords, defined in base/graphics.jl:
function set_coords(ctx::GraphicsContext, x, y, w, h, l, r, t, b)x (horizontal) and y (vertical) specify the upper-left corner of the drawing region in device coordinates, and w and h its width and height, respectively. (Note Cairo uses (0,0) for the top-left corner of the window.) l, r, t, and b are the user coordinates corresponding to the left, right, top, and bottom, respectively, of this region. Note that set_coords will also clip any drawing that occurs outside the region defined by x, y, w, and h; however, the coordinate system you've specified extends to infinity, and you can draw all the way to the edge of the canvas by calling reset_clip().
Let's fill the drawing region with a color, so we can see it:
# Set coordinates to go from 0 to 10 within a 300x100 centered region
set_coords(ctx, 50, 50, 300, 100, 0, 10, 0, 10)
set_source_rgb(ctx, 0, 0, 1)   # set color to blue
paint(ctx)                     # paint the entire clip region
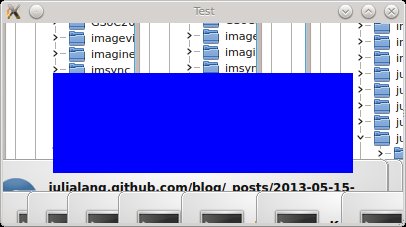
Perhaps surprisingly, nothing happened. The reason is that the Tk Canvas implements a technique called double buffering, which means that you do all your drawing to a back (hidden) surface, and then blit the completed result to the front (visible) surface. We can see this in action simply by bringing another window over the top of the window we're using to draw, and then bringing our window back to the top; suddenly you'll see a nice blue rectangle within the window, surrounded by whatever is in the background window(s):
Fortunately, to display your graphics you don't have to rely on users changing the stacking order of windows: call reveal(c) to update the front surface with the contents of the back surface, followed by update() (or perhaps better, Tk.update() since update is a fairly generic name) to give Tk a chance to expose the front surface to the OS's window manager.
Now let's draw a red line:
move_to(ctx, -1, 5)
line_to(ctx, 7, 6)
set_source_rgb(ctx, 1, 0, 0)
set_line_width(ctx, 5)
stroke(ctx)
reveal(c)
Tk.update()
We started at a position outside the coordinate region (we'll get to see the clipping in action this way). The next command, line_to, creates a segment of a path, the way that regions are defined in Cairo. The stroke command draws a line along the trajectory of the path, after which the path is cleared. (You can use stroke_preserve if you want to re-use this path for another purpose later.)
Let's illustrate this by adding a solid green rectangle with a magenta border, letting it spill over the edges of the previously-defined coordinate region:
reset_clip(ctx)
rectangle(ctx, 7, 5, 4, 4)
set_source_rgb(ctx, 0, 1, 0)
fill_preserve(ctx)
set_source_rgb(ctx, 1, 0, 1)
stroke(ctx)
reveal(c)
Tk.update()
fill differs from paint in that fill works inside the currently-defined path, whereas paint fills the entire clip region.
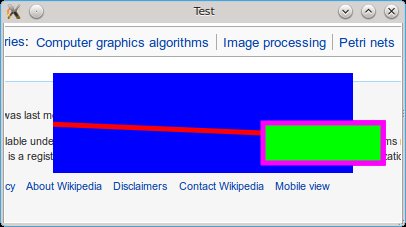
Here is our masterpiece, where the "background" may differ for you (mine was positioned over the bottom of a wikipedia page):
Rendering an image
Images are rendered in Cairo inside a rectangle (controlling placement of the image) followed by fill. So far this is just like the simple drawing above. The difference is the source, which now will be a surface instead of an RGB color. If you're drawing from Julia, chances are that you want to display an in-memory array. The main trick is that Cairo requires this array to be a matrix of type Uint32 encoding the color. The scheme is that the least significant byte is the blue value (ranging from 0x00 to 0xff), the next is green, and the next red. (The most significant byte can encode the alpha value, or transparency, if you specify that transparency is to be used in your image surface.)
Both Winston and Images can generate a buffer of Uint32 for you. Let's try the one in Images:
using Images
img = imread("some_photo.jpg")
buf = uint32color(img)'
image(ctx, CairoRGBSurface(buf), 0, 0, 10, 10)
reveal(c)
Tk.update()
Rather than manually calling rectangle and fill, we use the convenience method image(ctx, surf, x, y, w, h) (defined in Cairo.jl). Here x, y, w, h are user-coordinates of your canvas, not pixels on the screen or pixels in your image; being able to express location in user coordinates is the main advantage of using image().
The image should now be displayed within your window (squashed, because we haven't worried about aspect ratio):
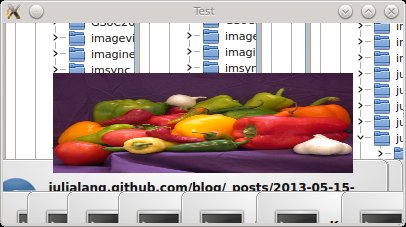
It fills only part of the window because of the coordinate system we've established, where the range 0:10 corresponds to an inset region in the center of the window.
While it's a minor point, note that CairoRGBSurface takes a transpose for you, to convert from the column-major order of matrices in Julia to the row-major convention of Cairo. Images avoids taking transposes unless necessary, and is capable of handling images with any storage order. Here we do a transpose in preparation to have it be converted back to its original shape by CairoRGBSurface. If performance is critical, you can avoid the default behavior of CairoRGBSurface by calling CairoImageSurface directly (see the Cairo.jl code).
Redrawing & resize support
A basic feature of windows is that they should behave properly under resizing operations. This doesn't come entirely for free, although the grid (and pack) managers of Tk take care of many details for us. However, for Canvases we need to to do a little bit of extra work; to see what I mean, just try resizing the window we created above.
The key is to have a callback that gets activated whenever the canvas changes size, and to have this callback capable of redrawing the window at arbitrary size. Canvases make this easy by having a field, resize, that you assign the callback to. This function will receive a single argument, the canvas itself, but as always you can provide more information. Taking our image example, we could set
c.resize = c->redraw(c, buf)and then define
function redraw(c::Canvas, buf)
    ctx = getgc(c)
    set_source_rgb(ctx, 1, 0, 0)
    paint(ctx)
    set_coords(ctx, 50, 50, Tk.width(c)-100, Tk.height(c)-100, 0, 10, 0, 10)
    image(ctx, CairoRGBSurface(buf), 0, 0, 10, 10)
    reveal(c)
    Tk.update()
end
Here you can see that we're aiming to be a bit more polished, and want to avoid seeing bits of the desktop around the borders of our drawing region. So we fill the window with a solid color (but choose a garish red, to make sure we notice it) before displaying the image. We also have to re-create our coordinate system, because that too was destroyed, and in this case we dynamically adjust the coordinates to the size of the canvas. Finally, we redraw the image. Note we didn't have to go through the process of converting to Uint32-based color again. Obviously, you can use this redraw function even for the initial rendering of the window, so there's really no extra work in setting up your code this way.
If you grab the window handle and resize it, now you should see something like this:
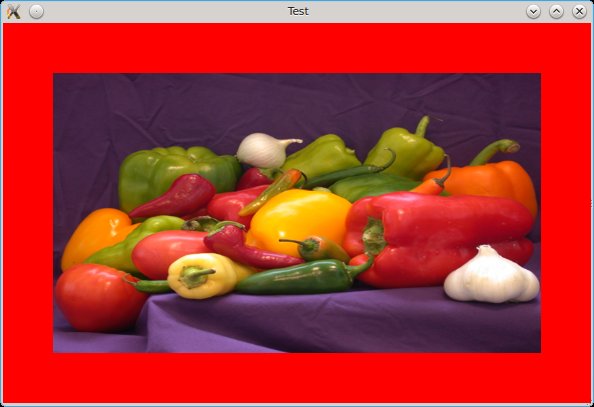
Voila! We're really getting somewhere now.
Unlike the complete GUI, this implementation doesn't have the option to preserve the image's aspect ratio. However, there's really no magic there; it all comes down to computing sizes and controlling the drawing region and coordinate system.
One important point: resizing the window causes the existing Cairo context(s) to be destroyed, and creates new ones suitable for the new canvas size. One consequence is that your old ctx variable is now invalid, and trying to use it for drawing will cause a segfault. For this reason, you shouldn't ever store a ctx object on its own; always begin drawing by calling getgc(c) again.
Canvases and the mouse
A Canvas already comes with a set of fields prepared for mouse events. For example, in the complete GUI we have the equivalent of the following:
selectiondonefunc = (c, bb) -> zoombb(imgc, img2, bb)
c.mouse.button1press = (c, x, y) -> rubberband_start(c, x, y, selectiondonefunc)rubberband_start, a function defined in rubberband.jl, will now be called whenever the user presses the left mouse button. selectiondonefunc is a callback that we supply; it will be executed when the user releases the mouse button, and it needs to implement whatever it is we want to achieve with the selected region (in this case, a zoom operation). Part of what rubberband_start does is to bind selectiondonefunc to the release of the mouse button, via c.mouse.button1release. bb is a BoundingBox (a type defined in base/graphics.jl) that will store the region selected by the user, and this gets passed to selectiondonefunc. (The first two inputs to zoombb, imgc and img2, store settings that are relevant to this particular GUI but will not be described in detail here.)
The mouse inside a Canvas is an object of type MouseHandler, which has fields for press and release of all 3 mouse buttons and additional ones for motion. However, a few cases (which happen to be relevant to this GUI) are not available in MouseHandler. Here are some examples of how to configure these actions:
# Bind double-clicks
bind(c.c, "", (path,x,y)->zoom_reset(imgc, img2))
# Bind Shift-scroll (using the wheel mouse)
bindwheel(c.c, "Shift", (path,delta)->panhorz(imgc,img2,int(delta)))
The delta argument for the wheel mouse will encode the direction of scrolling.
The rubber band (region selection)
Support for the rubber band is provided in the file rubberband.jl. Like navigation.jl, this is a stand-alone set of functions that you should be able to incorporate into other projects. It draws a dashed rectangle employing the same machinery we described at the top of this page, with slight modifications to create the dashes (through the set_dash function). By now, this should all be fairly straightforward.
However, these functions use one additional trick worth mentioning. Let's finally look at the Tk Canvas object:
type Canvas
    c::TkWidget
    front::CairoSurface  # surface for window
    back::CairoSurface   # backing store
    frontcc::CairoContext
    backcc::CairoContext
    mouse::MouseHandler
    redraw

    function ...
Here we can explicitly see the two buffers, used in double-buffering, and their associated contexts. getgc(c), where c is a Canvas, simply returns backcc. This is why all drawing occurs on the back surface. For the rubber band, we choose instead to draw on the front surface, and then (as the size of the rubber band changes) "repair the damage" by copying from the back surface. Since we only have to modify the pixels along the band itself, this is fast. You can see these details in rubberband.jl.
Winston
For many GUIs in Julia, an important component will be the ability to display data graphically. While we could draw graphs directly with Cairo, it would be a lot of work to build from scratch; fortunately, there's an excellent package, Winston, that already does this.
Since there's a nice set of examples of some of the things you can do with Winston, here our focus is very narrow: how do you integrate Winston plots into GUIs built with Tk. Fortunately, this is quite easy. Let's walk through an example:
using Tk
using Winston

win = Toplevel("Testing", 400, 200)
fwin = Frame(win)
pack(fwin, expand=true, fill="both")
We chose to fill the entire window with a frame fwin, so that everything inside this GUI will have a consistent background. All other objects will be placed inside fwin.
Next, let's set up the elements, a Canvas on the left and a single button on the right:
c = Canvas(fwin, 300, 200)
grid(c, 1, 1, sticky="nsew")
fctrls = Frame(fwin)
grid(fctrls, 1, 2, sticky="sw", pady=5, padx=5)
grid_columnconfigure(fwin, 1, weight=1)
grid_rowconfigure(fwin, 1, weight=1)

ok = Button(fctrls, "OK")
grid(ok, 1, 1)
Finally, let's plot something inside the Canvas:
x = linspace(0.0,10.0,1001)
y = sin(x)
p = FramedPlot()
add(p, Curve(x, y, "color", "red"))

Winston.display(c, p)
reveal(c)
Tk.update()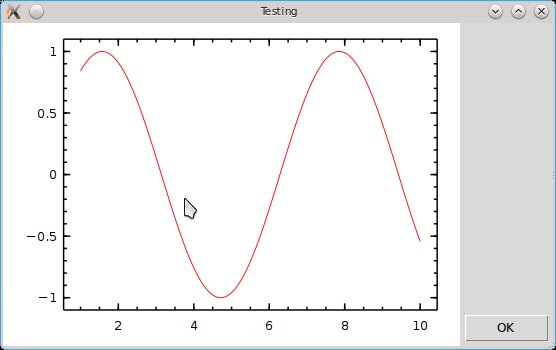
You'll note that you can resize this window, and the plot grows or shrinks accordingly.
Easy, huh? The only part of this code that is specific to GUIs is the line Winston.display(c, p), where we specified that we wanted our plot to appear inside a particular Canvas. Of course, there's a lot of magic behind the scenes in Winston, but covering its internals is beyond our scope here.
Conclusions
There's more one could cover, but most of the rest is fairly specific to this particular GUI. A fair amount of code is needed to handle coordinates: selecting specific regions within the 4d image, and rendering to specific regions of the output canvas. If you want to dive into these details, your best bet is to start reading through the ImageView code, but it's not going to be covered in any more detail here.
Hopefully by this point you have a pretty good sense for how to produce on-screen output with Tk, Cairo, and Winston. It takes a little practice to get comfortable with these tools, but the end result is quite powerful. Happy hacking!